Example 1
Initial prompt: hard rock
Predefined preference condition: music with a moderate tempo and a darker perceived character
Project Materials
This project explores how users can steer real-time music generation through repeated preference feedback while the music is still unfolding. Rather than relying on text alone, the system updates generation over time by comparing successive audio segments and using those comparisons to guide the next control decision.
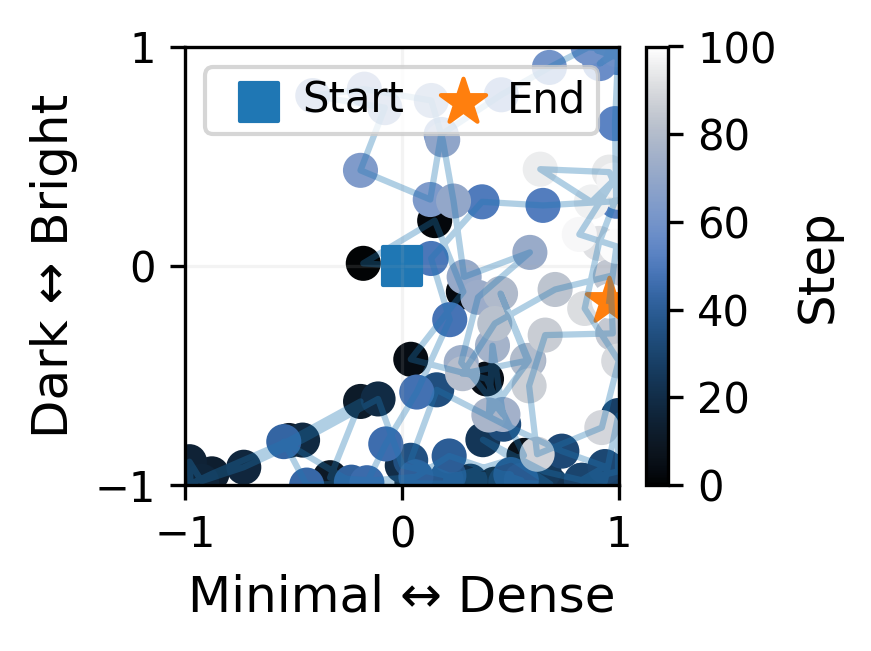
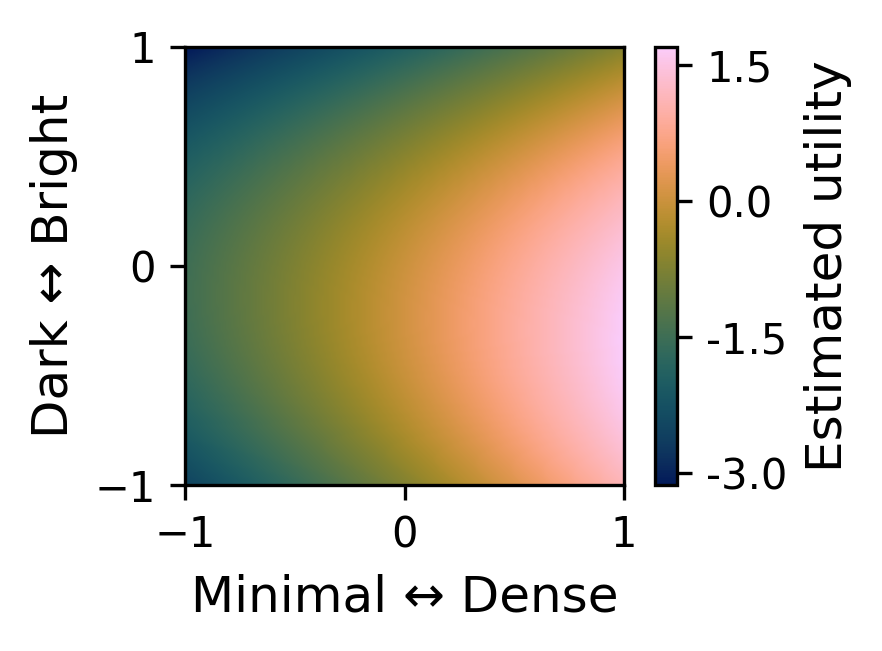
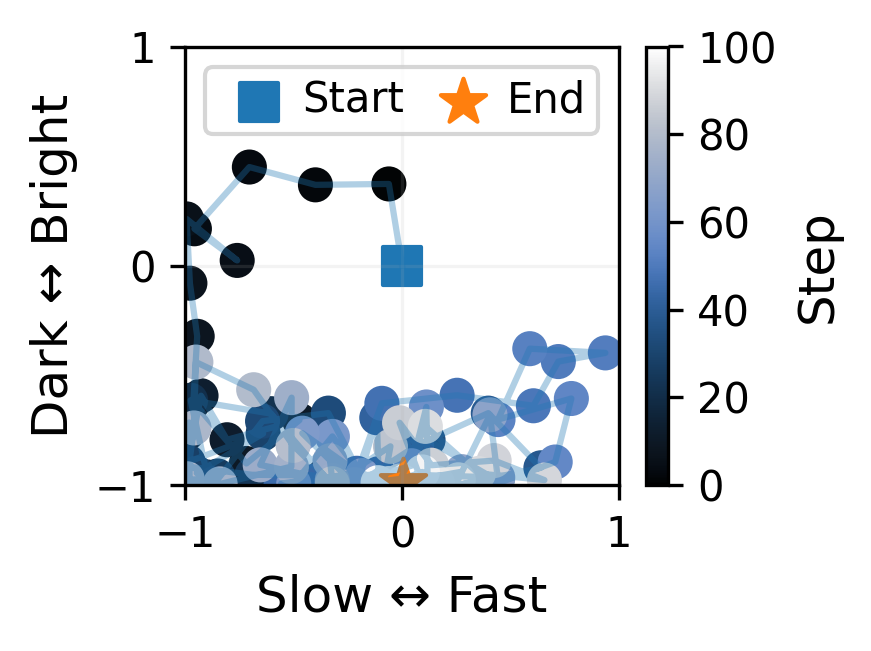
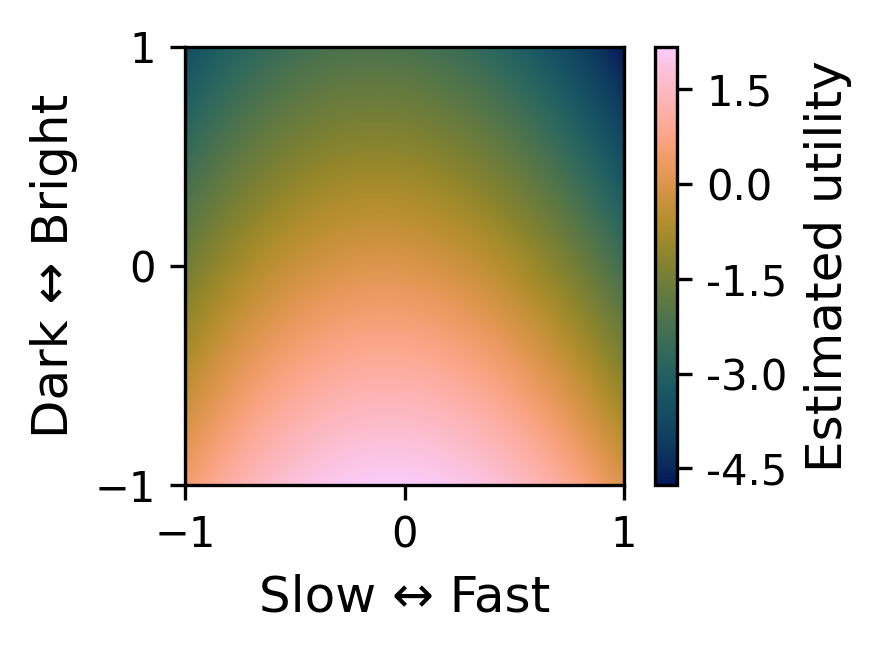
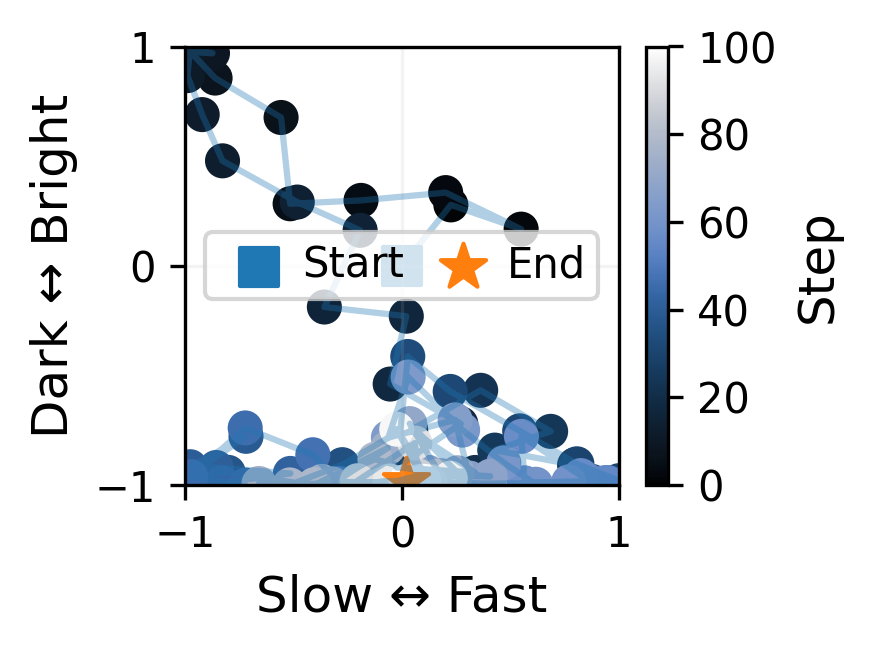
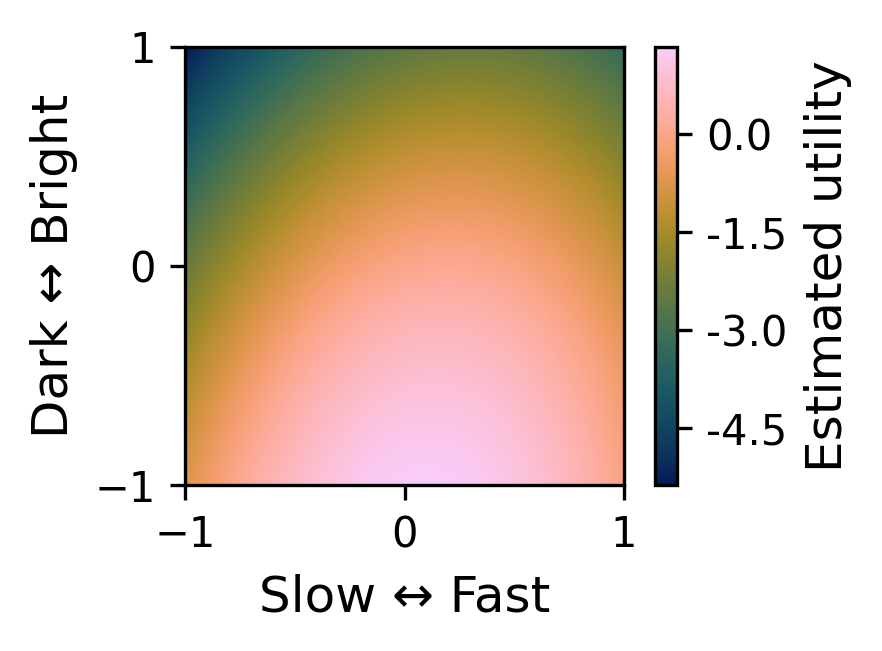
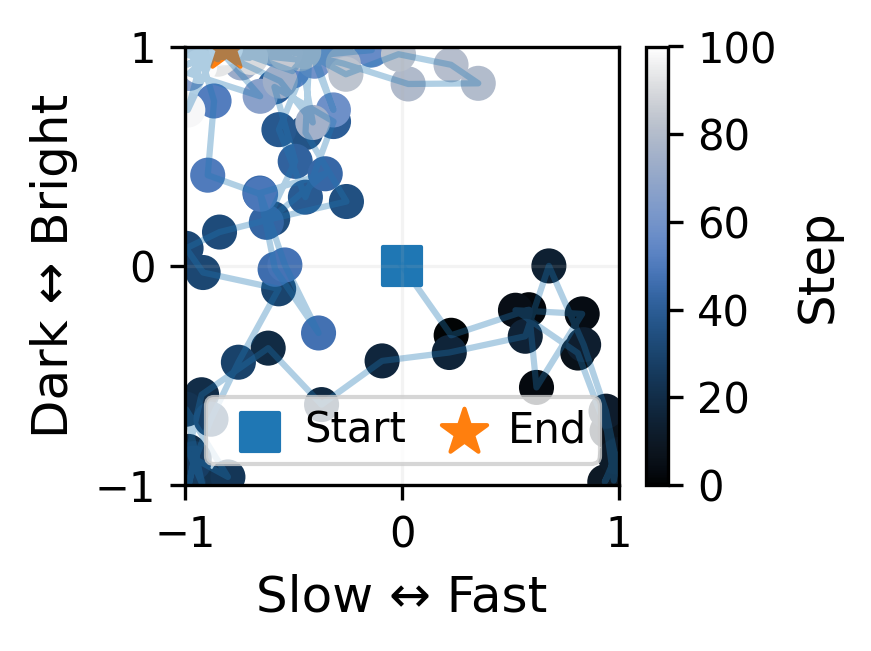
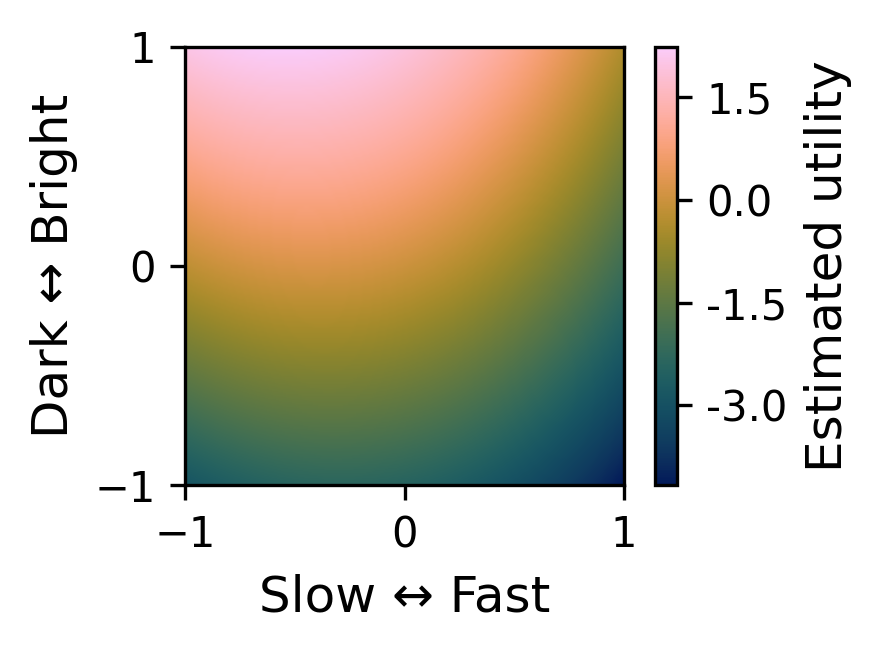
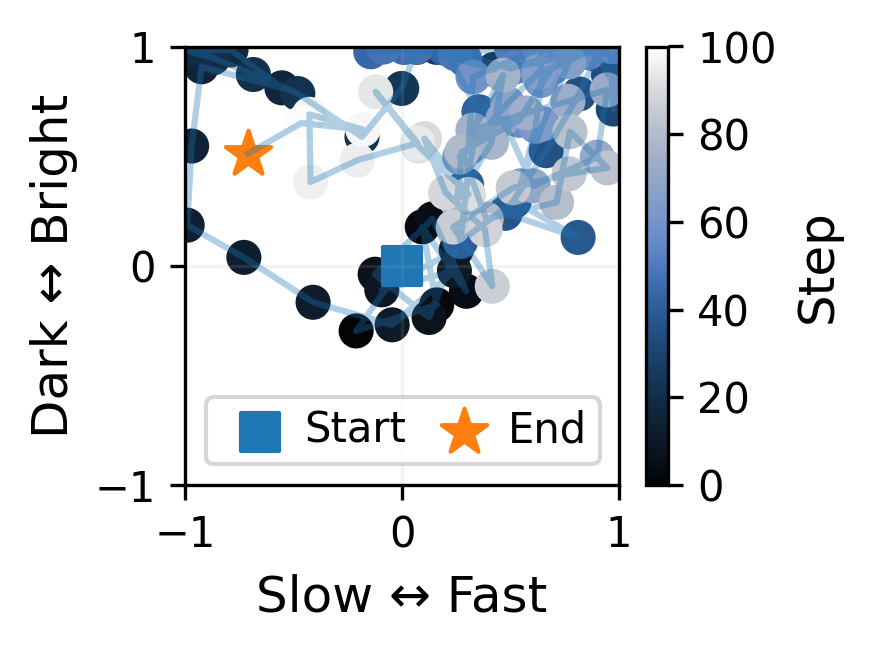
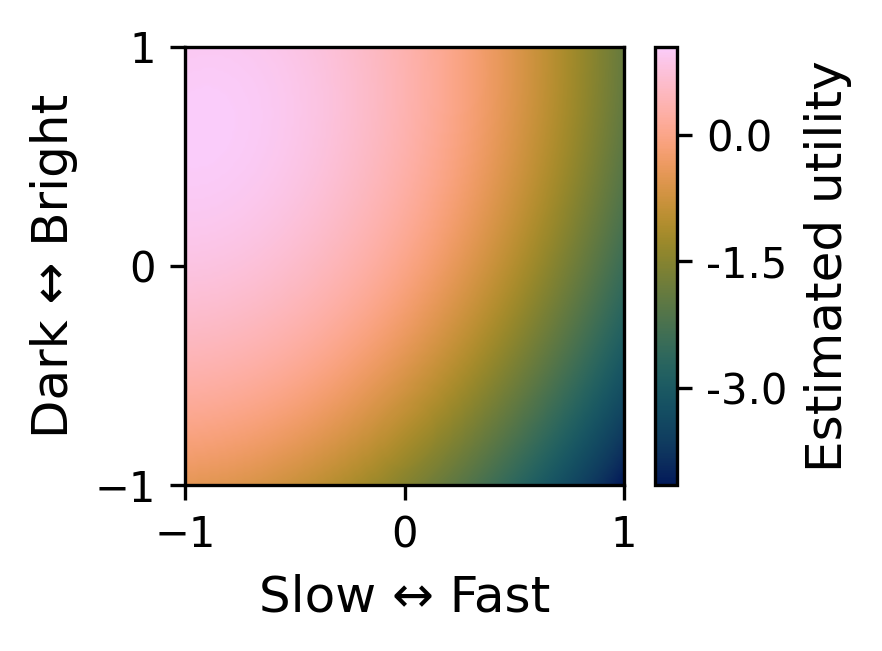
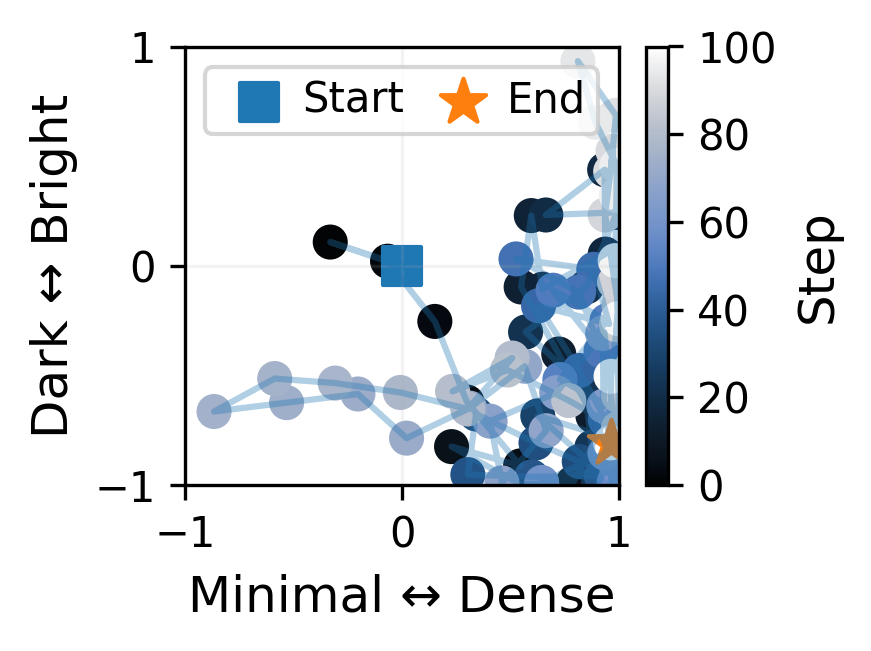
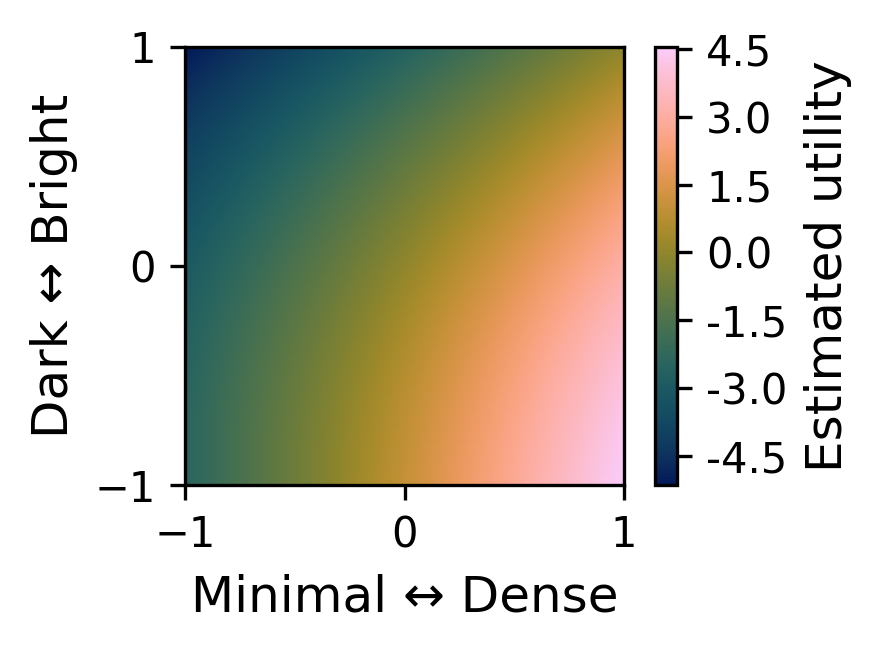
This page collects example materials from the project. Each example consists of a video and two visualizations: a trajectory showing how the system moves through the local control space over time in response to accumulated preference feedback, and an estimated utility map showing which regions of the local control space are inferred to be more or less preferred based on the accumulated feedback.
In the prototype system, music is generated as a continuous stream. The stream is divided into successive 10-second segments, and after each new segment, the user compares it with the immediately preceding one and indicates whether it is preferred, less preferred, or roughly similar.
These repeated comparisons are used to update the system’s estimate of local user preference and to select the next control setting for subsequent generation. The examples below illustrate this interaction process and the evolving internal state of the system. The user does not directly observe or manipulate the underlying control coordinates; instead, interaction is mediated entirely through listening and feedback on adjacent segments.
The figures show the optimization trajectory and estimated utility surface at the final step of an interaction, while the videos show how the feedback, trajectory, and utility estimate evolve over time together with the generated music.
The predefined preference conditions shown in these examples are included only to facilitate interpretation of the pilot demonstrations. More broadly, the goal of the system is not to optimize toward a fixed predefined target, but to support an interactive setting in which user preferences can emerge, shift, and become more refined during listening.
Initial prompt: hard rock
Predefined preference condition: music with a moderate tempo and a darker perceived character
Initial prompt: hard rock
Predefined preference condition: music with a moderate tempo and a darker perceived character
Initial prompt: hard rock
Predefined preference condition: music with a slow tempo and a brighter perceived character
Initial prompt: hard rock
Predefined preference condition: music with a slow tempo and a brighter perceived character
Initial prompt: techno
Predefined preference condition: techno with a darker timbral character and denser texture
Initial prompt: techno
Predefined preference condition: techno with a darker timbral character and denser texture